Otso Monthly - April 2026
How did we perform?
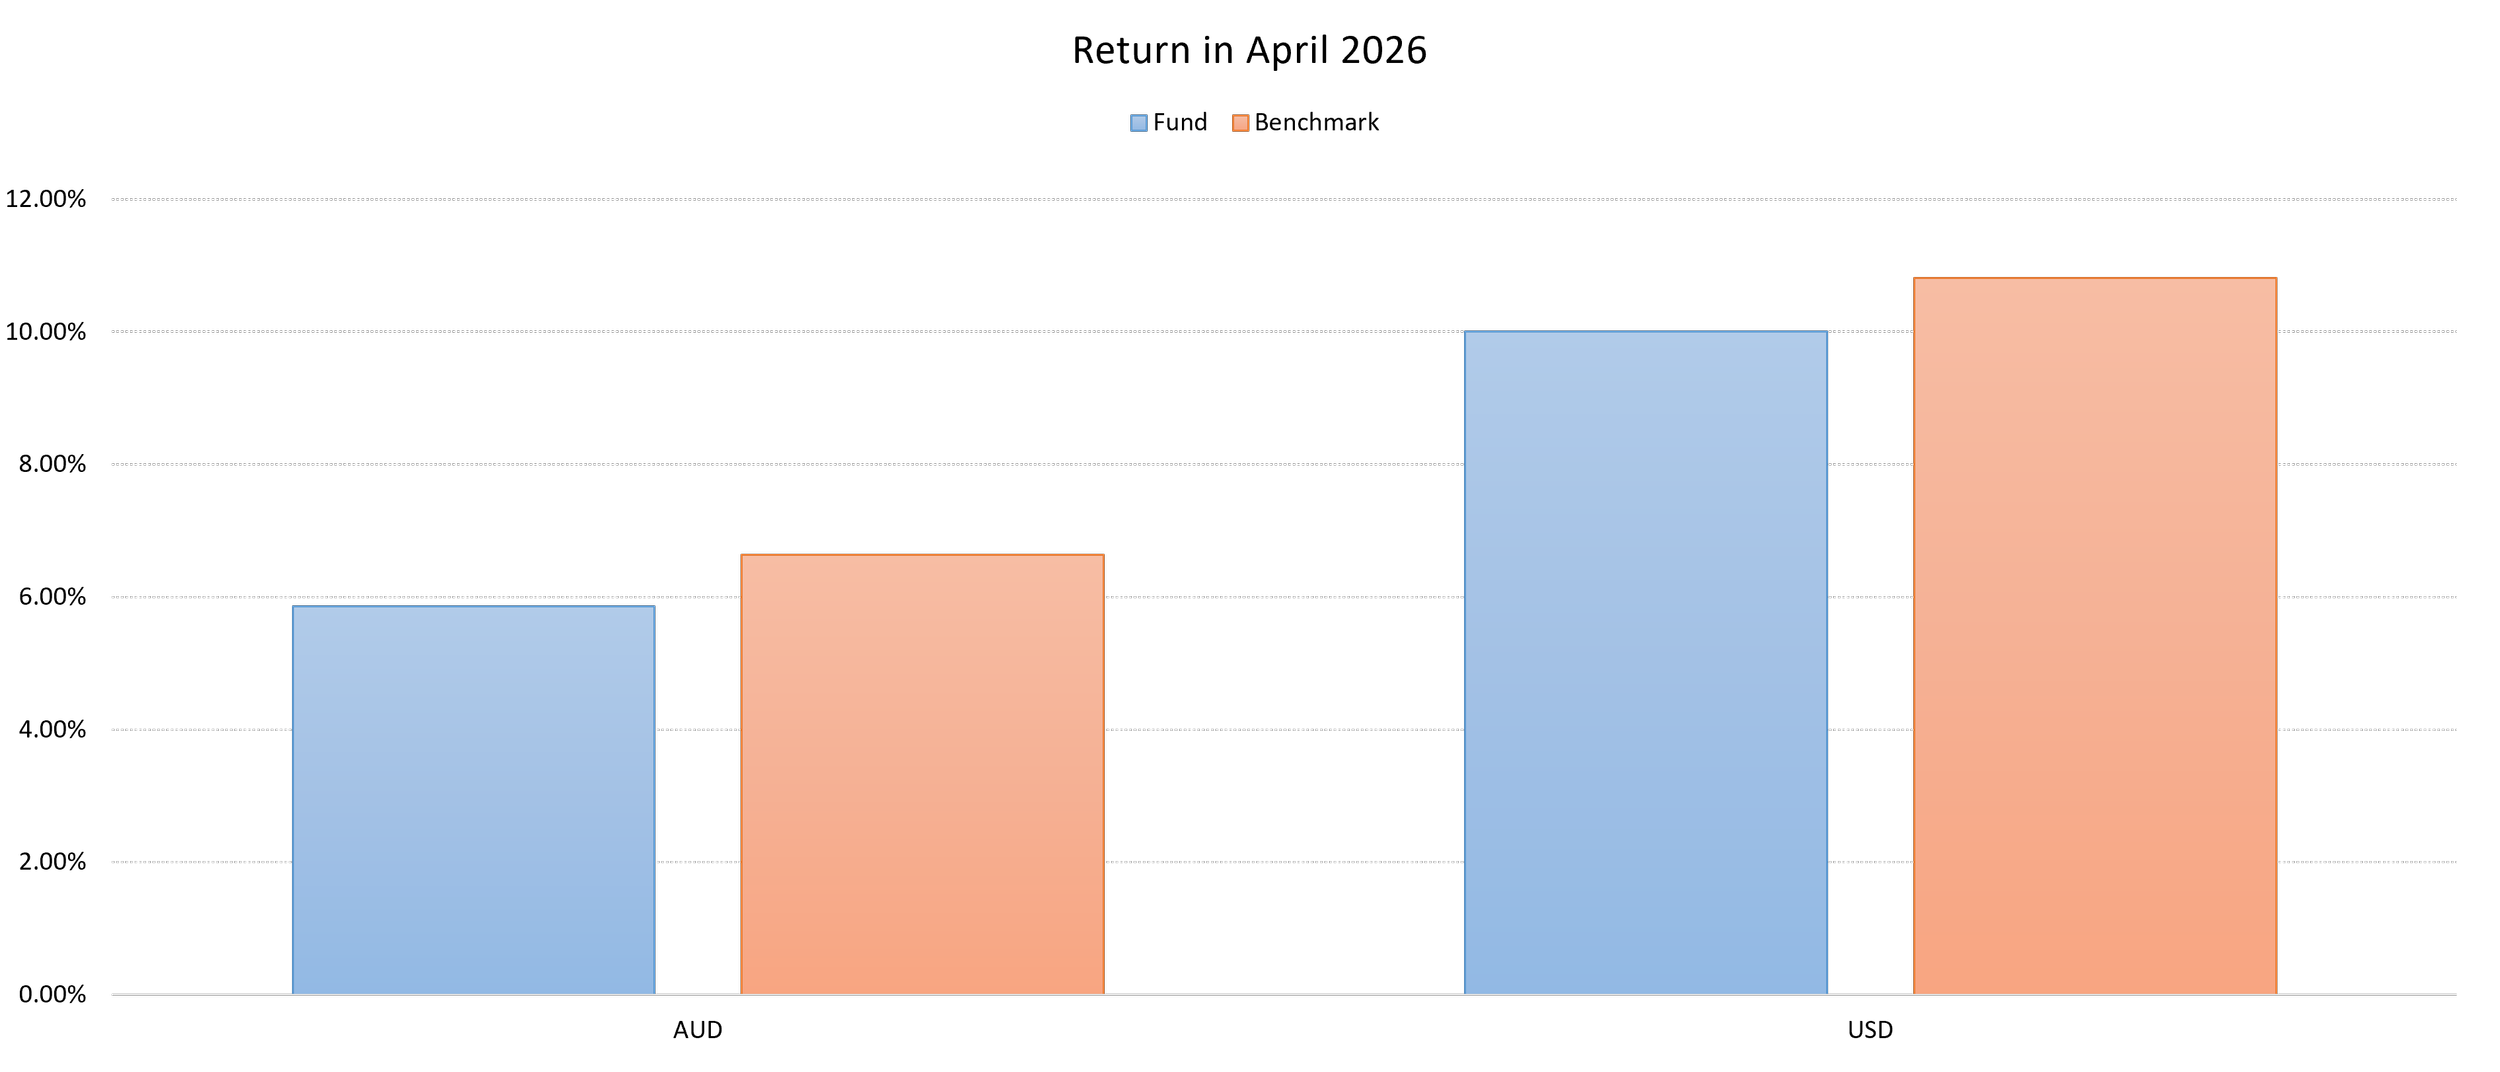
We delivered strong returns during April. So did the broader market. We slightly underperformed the benchmark. In USD terms, we delivered approximately 10%, whereas the benchmark delivered 10.81%. In AUD terms, we delivered 5.86% and the benchmark delivered 6.64%. April was a strong market for US equities. However, the AUD strengthened, reducing the AUD value of USD holdings.
The main reason we slightly underperformed the benchmark was caution over the Straight of Hormuz and Iran. Given the uncertainty and volatility associated with the Iran situation, we took a cautious approach. However, ex post, the market pushed through trade and conflict uncertainty.
We have had strong performance over time. While we marginally underperformed the benchmark in April 2026, we have historically consistently outperformed the benchmark.

What happened in April?
April 2026 Market Recap: A Powerful Rebound from an Oversold Setup
After a punishing March that saw the S&P 500 fall nearly 8% on escalating US–Iran tensions, April delivered one of the strongest monthly rallies of the past two decades. The S&P 500 climbed roughly 10.5%, marking its best month since November 2020. The Nasdaq-100 surged 15.7%. This is its strongest single-month return since October 2002, more than 23 years ago. Small caps participated forcefully: the Russell 2000 rose 12.3%, its best month since the post-pandemic reopening rally of late 2020, and the Russell Microcap Index gained 12.8%. New all-time highs were set across multiple major indices.
The rally was striking not only for its magnitude but for its breadth. Of the 128 Nasdaq indices tracked in their monthly scorecard, 125 finished April in positive territory. The S&P MidCap 400 added roughly 8% and the S&P SmallCap 600 advanced more than 10%. This was a "rising tide" month rather than a megacap-led move, a meaningful shift from the narrow leadership that characterized 2023–2025.
A reversal of sentiment
Markets entered April deeply oversold. Sentiment had been crushed by the conflict in Iran, positioning was light, and capitulation behavior was visible across multiple risk measures. That setup is often a precondition for sharp reversals, and April provided the catalyst. Headlines around the US–Iran conflict gradually stabilized through the month, and while the Strait of Hormuz remained a flashpoint and oil prices held above $110 a barrel, investors began to look past the geopolitical fog toward fundamentals.
Earnings did the heavy lifting
The single most important driver of the April rally was the Q1 2026 earnings season, which began in mid-April and exceeded almost every metric analysts had set. Heading into the quarter, FactSet's consensus called for year-over-year S&P 500 earnings growth of 13.1%. By month-end, with about 28% of companies reported, 84% had beaten EPS estimates, well above the 5-year average of 78% and the 10-year average of 76%. The aggregate earnings surprise stood at 12.3%, nearly double the long-run norm. The blended year-over-year growth rate ultimately rose toward 27% by early May, putting Q1 2026 on course to be the sixth consecutive quarter of double-digit earnings growth.
Industrials, Information Technology, Financials, and Communication Services were the largest positive contributors. Net profit margin for the S&P 500 sat at 13.4%, on track to be the highest since FactSet began tracking the metric in 2009. Analysts responded by revising Q2 and full-year 2026 estimates higher. This was a notable shift in a quarter where geopolitical risk was supposed to compress margins.
Tech and AI back in the driver's seat
Semiconductors led within technology, with the Nasdaq-100 Technology Sector Index gaining 23.5% in April. Renewed optimism around AI monetization — particularly hyperscaler capital spending plans disclosed during earnings calls — drove the move. That said, the year-to-date picture remains more nuanced. Through April, none of the Magnificent Seven stocks were among the top five performing sectors of 2026 (those being Energy, Industrials, Materials, Real Estate, and Consumer Staples). The Mag 7 represent about a third of S&P 500 weight but have contributed only around 15% of the index's year-to-date return, versus roughly 43–60% in each of the prior three calendar years. The market is broadening, even as April reminded investors that megacap tech can still deliver outsized monthly moves.
Macro and policy crosscurrents
Not everything was tailwind. US CPI rose 0.90% month-over-month to 3.3%. This was the largest monthly jump since April 2021, driven largely by energy. Core inflation rose a more modest 0.10% to 2.6%. Manufacturing held up reasonably well, with the ISM PMI steady at 52.7 for a second consecutive month.
The Federal Reserve held rates at 3.50–3.75% at the April FOMC meeting, which was Chair Powell's final meeting in that role. With energy-driven inflation pressures building, the CME FedWatch tool ended April pricing less than a 5% probability of a cut at the June 17 meeting. The "higher for longer" path that markets had largely dismissed earlier in the year is back on the table.
Valuations have risen alongside earnings. The forward 12-month S&P 500 P/E ended April near 20.9x, modestly above both the 5-year average (19.9x) and the 10-year average (18.9x), supported by the strength and breadth of earnings growth, but leaving less margin for disappointment.
Looking ahead: Australia’s budget disaster
The market entered May after a strong April, but nevertheless against the backdrop of ongoing conflict in the Middle East. Furthermore, in Australia, the beginning of May faced the looming prospect of an adverse Federal budget. At the time of writing, May has been another strong month for stock returns in the US.
The bigger concern in Australia is the Federal Budget. The Prime Minister and Treasurer lied to Australians about their intentions in relation to capital gains tax. In the 2025 federal election, they said they would not increase CGT. Barely 12 months later, they have decided to do so while pretending to have “changed their mind” as circumstances change. They are gaslighting: it is implausible that circumstances changed in under 12 months. It is very clear that the ALP lied to get elected in 2025. This sets a troubling precedent. Politicians carry very little trust. But, such blatant and unashamed lies create sovereign risk.
Our founder – Mark Humphery – did make submissions to the CGT inquiry and gave evidence at the Senate inquiry into CGT changes. Alas, our submissions fell on deaf ears.
The Federal Budget revealed a significant increase in Capital Gains Tax. Heretofore, Australia would tax capital gains at the individual’s marginal tax rate, with a 50% discount on assets held for more than 12 months. For most people, this meant that the rate would be between 23.5% and 47%. Australia’s CGT rate was already uncompetitively high. For example, the CGT rate in NZ, Dubai, SG, and HK is 0%.
Australia has decided to make a bad situation worse. The Australian budget flags dramatic increases in CGT. And, the better your performance, the higher the tax rate. The budget would impose a minimum 30% CGT on all sales. This is already a significant increase from the 23.5% under the old regime. Not only that, the system would replace the long term capital gains tax discount with a system of inflation indexed capital bases. This means, one would be taxed on the real return on any asset. Of course, any losses carried forward, are not indexed. This means that if an investment outperforms inflation, then the CGT applicable will tend toward s 47%. The rates are uncompetitive. We are taking advice on the best way forward.
We encourage all investors to write to their local politician (or, any and every politician) to express their displeasure. CGT should be lower, not higher.