Otso Monthly – July 2026
How we did
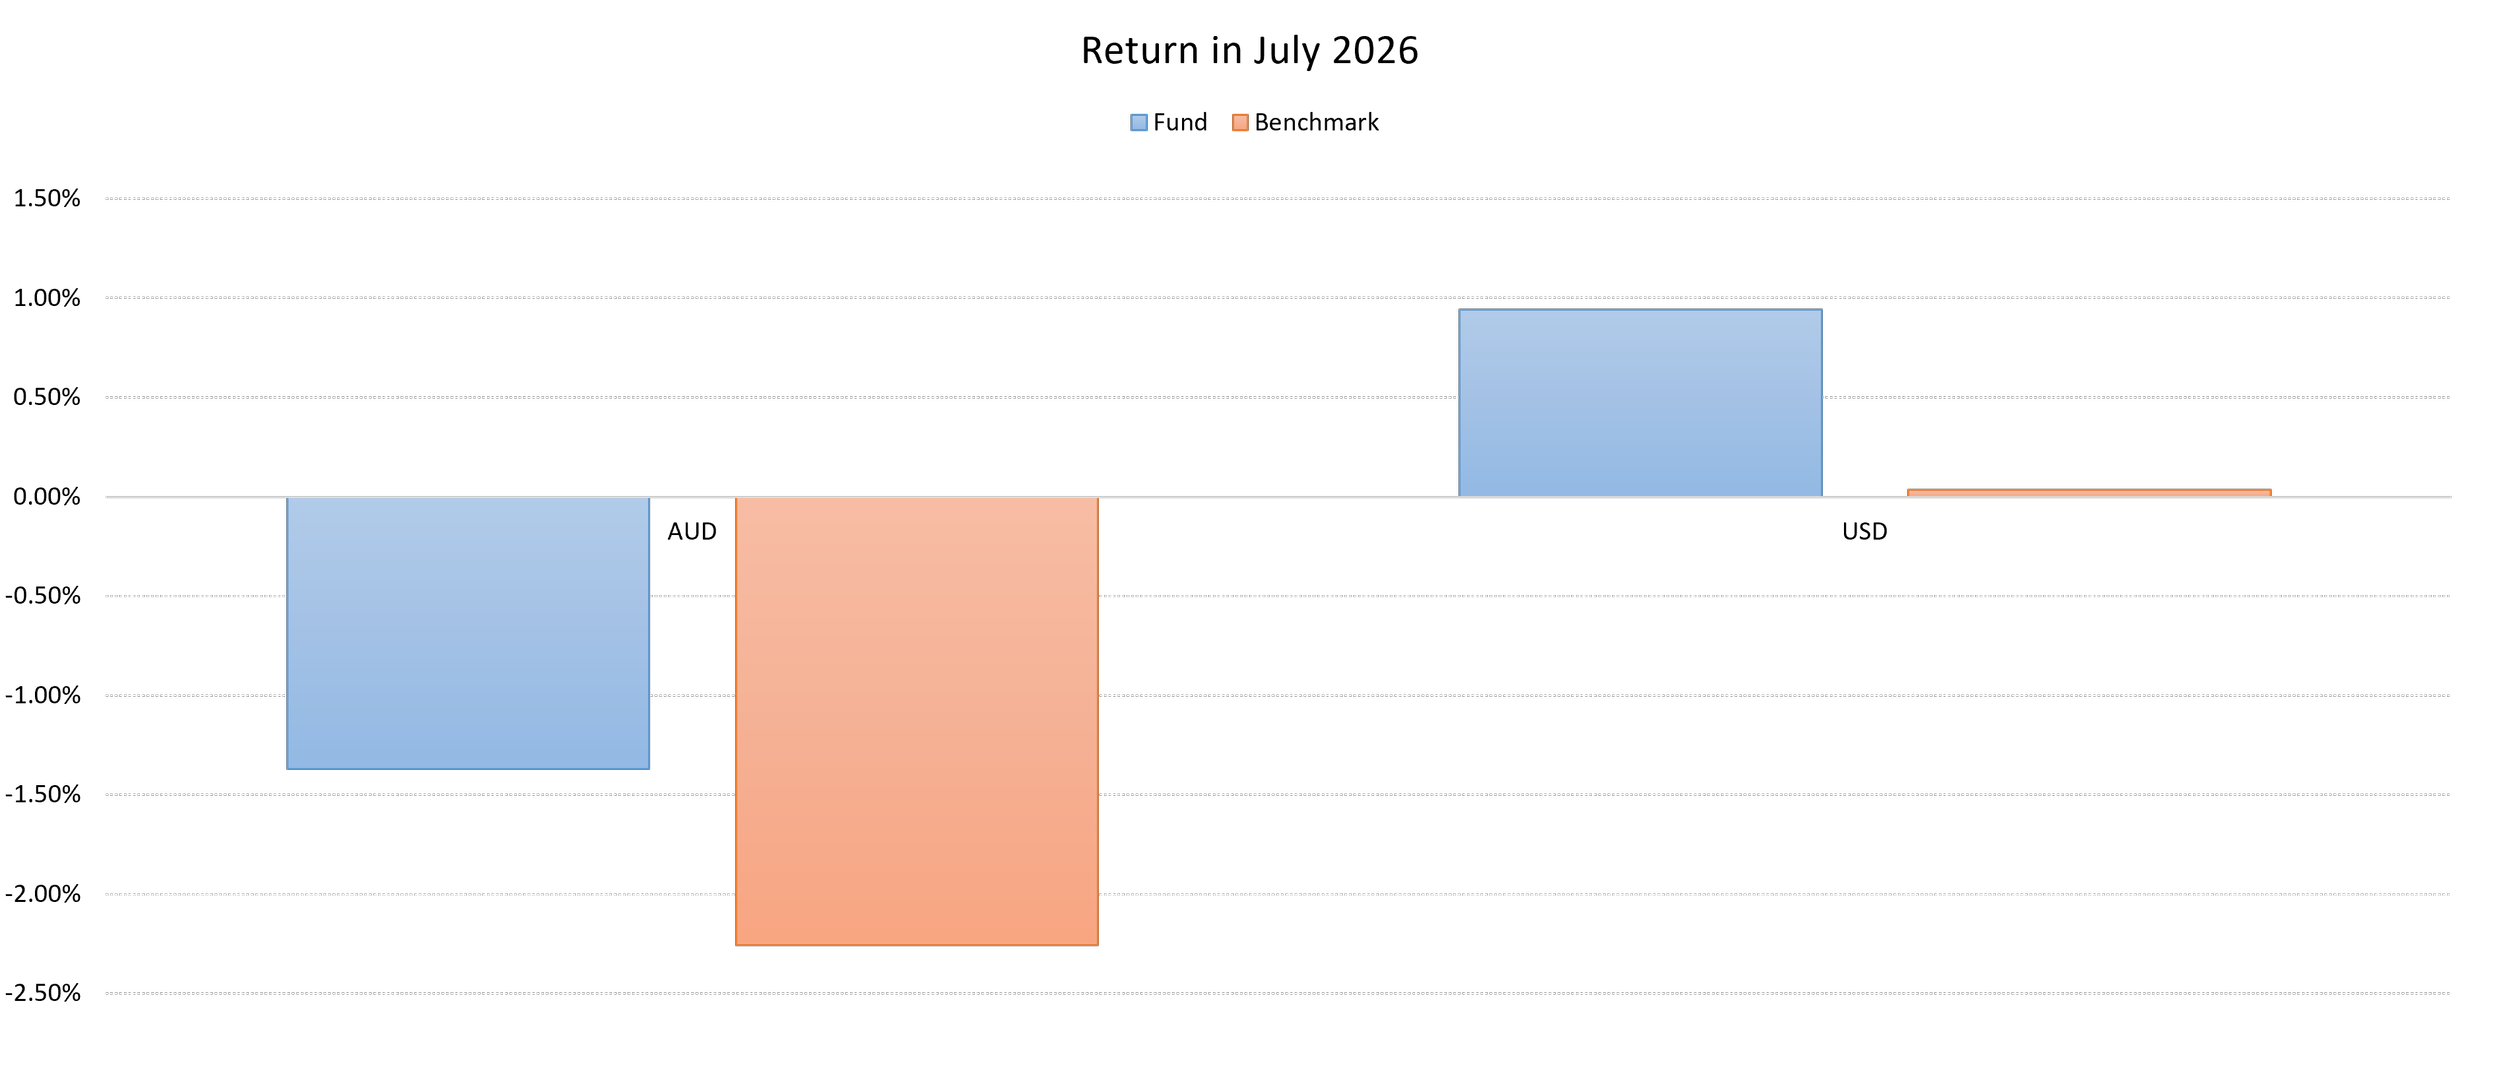
Otso outperformed the S&P500 benchmark, slightly. However, the appreciation in the AUD caused both us, and the S&P500, to fall in AUD terms. Specifically, the S&P500, as proxied by SPY, rose only 0.35% during July (in USD terms). But, in AUD terms, it fell 2.26%. Similarly, Otso increased 0.94% in July in USD terms but fell 1.37% in AUD terms. We regard the performance as unexceptional. Our performance is reported net of (i.e., after) fees.

What happened
The Great Rotation
July was a month of rotation, not retreat. The AI trade finally cooled after a historic second quarter. Money did not leave the market. It simply moved.
The numbers tell the story. The Nasdaq-100 fell 6.6% for the month. The Philadelphia Semiconductor Index dropped 20.6% in July and fell roughly 25% from its June high. That reversal came right after the index posted its best quarter since its 1994 inception. Meanwhile, the Dow Jones Industrial Average added 0.6%. The S&P 500 Equal Weight Index gained 1.0%.
Those gains look modest. The relative performance was anything but. The equal weight index beat the Nasdaq-100 by 7.5 percentage points. That was its best monthly outperformance since 2005, when comparable records begin. In short, the average stock did fine. The megacap tech complex did not. The S&P500 itself was close to flat on the month. This tells us there was significant heterogeneity.
What Drove the Shift
The catalyst was a change in the AI narrative. Investors stopped asking about demand. They started asking about monetization. When do these enormous capital spending plans pay off? How large will the returns be? Concerns about valuations, rising competition, and the risk of AI commoditization all fed the selloff in chips and related names.
Importantly, the damage looked technical rather than fundamental. The pullback appeared driven by crowded positioning and multiple compression. It did not reflect deteriorating business results. Earnings season made that clear, as we discuss below.
The Fed Holds, Yields Break Out
The Federal Reserve was the other major force in July. On July 29, the FOMC voted 9-3 to keep the federal funds rate at 3.50% to 3.75%. That marked the fifth consecutive hold. The statement offered no forward guidance. Chair Kevin Warsh struck a hawkish tone. He reaffirmed the 2% inflation target and warned that stubborn inflation could force rate hikes. He also defended the lack of guidance, calling it a crisis-era tool that markets should not depend on.
Bond markets reacted quickly. The 30-year Treasury yield broke above its post-COVID high of 5.18%. It ended July at 5.27%, the highest level since June 2007. Rising long rates pressured long-duration growth stocks. They also reinforced the rotation into sectors that benefit from higher rates and nominal growth.
Value Takes the Lead
The growth-to-value rotation accelerated sharply. Large-cap value gained 3.8% in July. Large-cap growth lost 5.9%. That 8.5 point spread ranks in the 99th percentile of monthly observations going back to 1979. This is not a one-month fluke. Value has now beaten growth in seven of the past nine months.
Sector results followed the same script. Seven of eleven large-cap sectors finished higher. Energy led with a 12.6% gain, boosted by renewed Middle East tensions. Energy is now up 34.7% for the year, more than double any other sector. Financials rose 6.2%, their best month since January 2025. Banks reported strong trading revenue, healthy deal activity, and improving margins. Insurance stocks broke out to new all-time highs.
Earnings: Historically Strong
Beneath the surface volatility, corporate America delivered. Through July 31, 61% of S&P 500 companies had reported second-quarter results. Of those, 86% beat earnings estimates and 77% beat on revenue. Both figures sit well above historical averages.
The size of the beats was remarkable. Companies topped earnings estimates by 31.4% on average, far above the 7% five-year norm. FactSet notes that if this holds, it would be the largest earnings surprise since its tracking began in 2008. Blended earnings growth for the quarter now stands at 47.4% year over year. Revenue growth of 14.1% would be the strongest since late 2021. Ten of eleven sectors are posting profit growth. This is not a market running on hope. Profits are doing the heavy lifting.
August Update: A Sharp Rebound
August brought a swift change in tone. The July jobs report showed a loss of 23,000 jobs against expectations for a gain of 83,000. Markets read the weakness as insurance against rate hikes. Stocks rallied hard. The Dow closed above 54,000 for the first time on August 4. The S&P 500 notched a record close of 7,757 on August 7 as tech and chip stocks bounced back. Cooler than expected CPI and PPI readings extended the rally mid-month, pushing the S&P 500 above 7,800 for the first time. The back half of the month was choppier. The 30-year yield touched a near two-decade high before a Treasury plan to double long-dated bond buybacks eased the pressure. Hawkish comments from Chair Warsh late in the month revived talk of a September hike. Even so, the S&P 500 sat near 7,712 as of August 28, up more than 5% for the month.
The Bottom Line
July rewarded diversification. Leadership broadened, value reasserted itself, and earnings impressed. The AI story is not over, but the market is now demanding proof, not promises. We will be watching yields, the Fed, and AI capital spending closely into the fall.